Flywheel quality comparison and PSNR
Flywheel decodes, composites, and re-encodes video. Some difference from the source is expected because encoding is lossy. A useful quality comparison checks both how closely the picture matches its source and whether every output shows the correct, current picture.
For configuration and routing, see Flywheel. For GPU availability and diagnostics, see NVIDIA GPU monitoring.
What PSNR measures
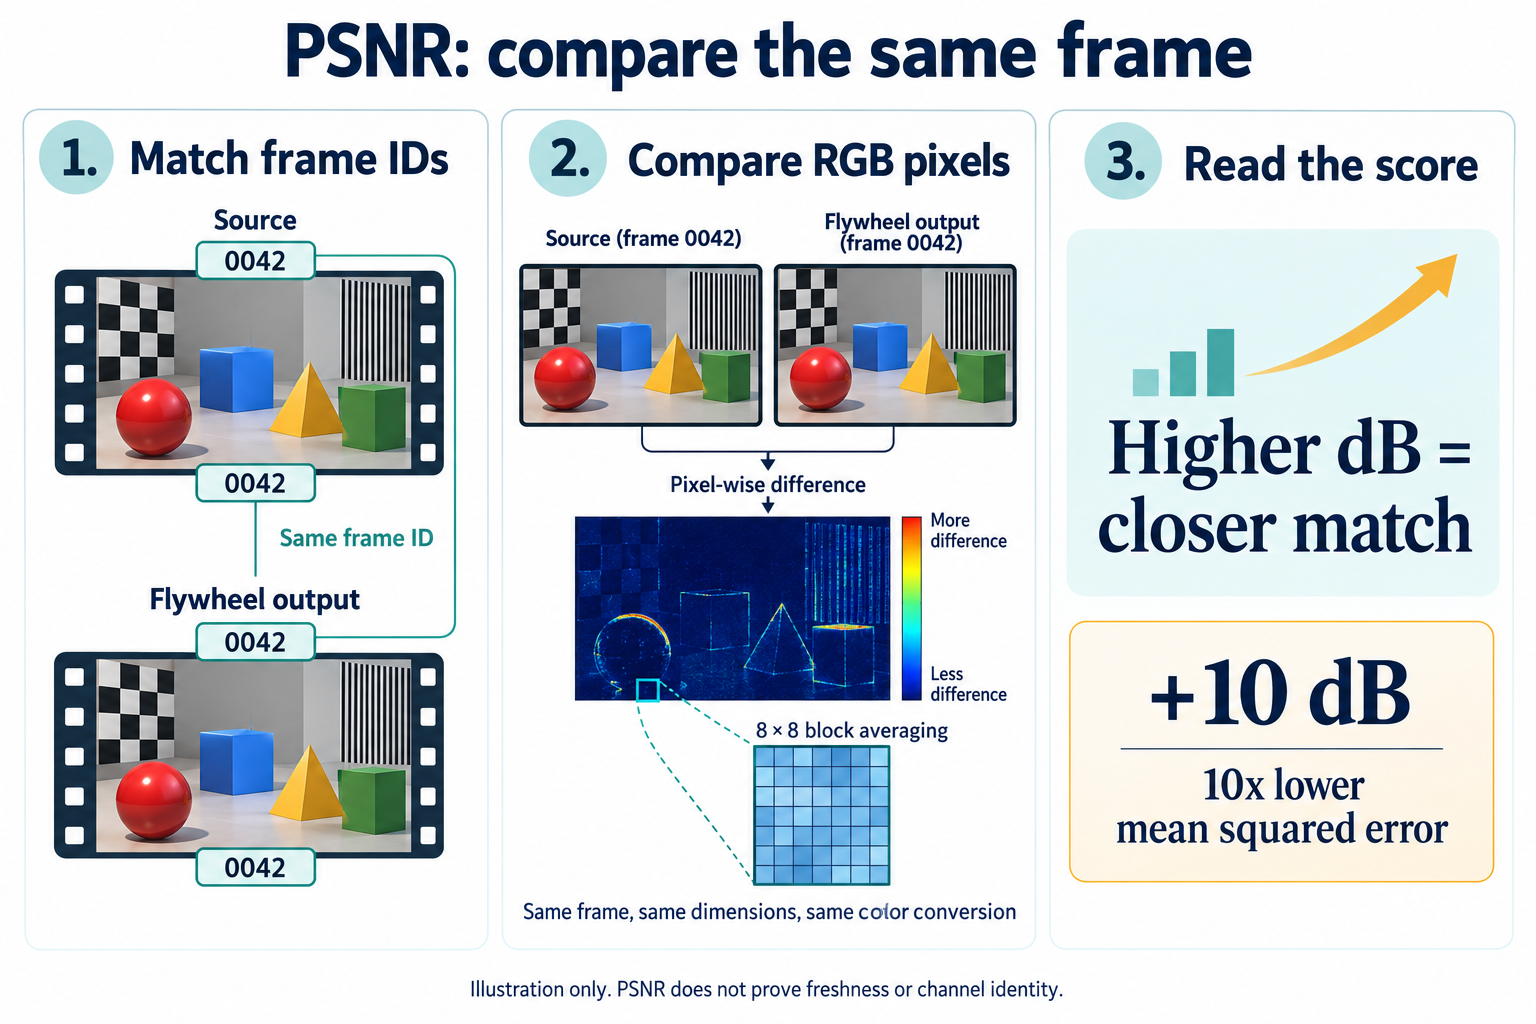
Peak Signal-to-Noise Ratio (PSNR) describes the pixel error between a reference picture and its processed output. It is expressed in decibels (dB). Higher values mean a closer numerical match, when the reference and measurement method are the same.
For an 8-bit RGB comparison:
MSE  = mean((output RGB - reference RGB)^2)
PSNR = 10 × log10(255^2 / MSE)
MSE is the mean squared error across the compared RGB samples. A 10 dB increase means ten times less MSE, provided the sample range and method are unchanged. It does not mean the picture looks ten times better. Identical samples have zero error - mathematically their PSNR is infinite, although a checker may cap the displayed value.
How the Flywheel picture checker compares frames
The numbered-frame qualification tools match output pictures to decoded source pictures using complementary frame markers at the top and bottom. They check marker agreement and ordering, convert pictures to RGB, and average each 8×8 pixel block before calculating matched-picture PSNR. The reported minMatchedRgbPsnr is the lowest score among the checked frames for that channel.
This is a reduced-resolution, matched-frame RGB measurement. It is not interchangeable with full-resolution PSNR, luma-only PSNR, or a whole-clip average. Block averaging can hide fine detail loss and small defects, inspect full-resolution output as well. A minimum score also depends on how many frames were checked, so compare like capture durations and sampling policies.
The checker evaluates the whole picture at its analysis resolution, not just the marker areas. Regional error checks help detect damage that a single global score could dilute. Whole-capture mode checks the capture interior after excluding boundary material that may contain partial transport packets or GOPs. Short sample mode covers a smaller interval, record which mode was used.
PSNR and human perception
PSNR measures numerical error, not human opinion. The same score can accompany different visible problems: a mild color shift across the whole frame, a blurred small object, or a damaged patch. Motion, scene texture, display size, viewing distance, and the importance of the affected detail all influence what a viewer notices.
The table below translates scores into root mean squared error (RMSE) for 8-bit samples. The visual notes describe what to inspect, rather than assigning universal quality grades.
| PSNR example | Equivalent RMSE, on a 0–255 scale | What it tells a viewer |
|---|---|---|
| 24 dB | About 16.1 sample levels | Larger numerical differences. Inspect color shifts, blur, blocking, orientation, and alignment to identify the cause. |
| 28 dB | About 10.2 sample levels | Smaller error than 24 dB, but no guarantee that task-critical details remain readable. |
| 34 dB | About 5.1 sample levels | A close numerical match. Fine text, thin lines, or moving targets can still require full-resolution inspection. |
| 40 dB | About 2.6 sample levels | Very small average numerical error. A local defect or a freshness failure can still matter. |
These RMSE values apply to the samples actually compared. With the block-averaged checker, they describe block averages, not errors at every original pixel.
Why a higher score may still disappoint
- A stale frame can score well. Matching a repeated output to its own old source frame may yield high PSNR while live motion has stopped. Frame progression and repeats must be checked separately.
- Small details may matter more than their area. Losing a vehicle marking or a thin target outline can be operationally significant even if most pixels remain close to the reference.
- An intentional overlay lowers source PSNR. Captions, graphics, and timeout visuals differ deliberately from unmodified source video. Use an expected rendered reference or assess those phases separately.
- Color handling can dominate the error. Inconsistent color matrix, range, transfer characteristics, or scaling can lower PSNR even when the encoder itself is working correctly.
For perceptual assessment, watch paired clips at the intended display size and playback speed, then inspect difficult frames at full resolution. SSIM or a suitable perceptual video metric can complement PSNR, they do not replace frame identity, freshness, or recovery checks. Structured subjective assessments should use controlled viewing conditions, such as those described in ITU-T P.910. The SSIM research paper explains why structural similarity can differ from squared-error measurements.
Example bitrate and resolution scenarios
The following is an example comparison plan, not a table of measured scores or recommended production bitrates. Use a clean moving reference, H.264 at 25 fps, the same encoder preset, rate-control mode and GOP, and no changing overlays. Compare GPU and CPU output at each identical setting.
| Output resolution | Video bitrate to test | Purpose and expected visual pressure |
|---|---|---|
| D1, 720×576 | 0.5 Mbps | Stress compression on motion, fine texture, and text. Look for blocking and loss of detail. |
| D1, 720×576 | 1 Mbps | An intermediate point for comparing detail retention against 0.5 and 2 Mbps. |
| D1, 720×576 | 2 Mbps | The baseline used in the D1 examples below, still verify difficult scenes. |
| 720p, 1280×720 | 1 Mbps | More pixels competing for the same bit budget as the D1 1 Mbps case. |
| 720p, 1280×720 | 2 Mbps | Compare a moderate bit budget with both 1 and 4 Mbps at this resolution. |
| 720p, 1280×720 | 4 Mbps | Test whether extra bits retain more texture and moving detail. |
| 1080p, 1920×1080 | 2 Mbps | Stress fine detail and motion at the same video bitrate as D1 2 Mbps. |
| 1080p, 1920×1080 | 4 Mbps | Check whether increasing bitrate reduces visible compression damage. |
| 1080p, 1920×1080 | 6 Mbps | A higher-budget comparison point, a high score still needs motion and identity checks. |
Within the same resolution, content, and encoder configuration, more bitrate generally gives the encoder more freedom to preserve detail. The resulting PSNR must be measured, bitrate does not determine a fixed dB value. At the same bitrate and frame rate, 1080p has five times as many pixels per frame as 720×576 D1. This increases compression pressure, but codec prediction and scene complexity prevent a simple five-to-one quality rule.
For example, a nearly static D1 scene at 1 Mbps may retain detail more easily than fast, textured 1080p video at 4 Mbps. A lower-resolution picture may look cleaner at a constrained bitrate while showing less spatial detail. Judge both the intended task and the displayed output.
Worked interpretation, using hypothetical scores: suppose the same 1080p clip measures 29 dB at 2 Mbps and 35 dB at 6 Mbps with otherwise identical settings. The 6 dB increase represents about four times less MSE. Inspect whether the extra bits improve moving detail, text, and edges at the intended viewing size, the score alone does not establish the perceived improvement. These numbers demonstrate the calculation, not expected results for those bitrates.
Make cross-resolution comparisons fair
For a D1 output, create a D1 reference from the same source using the declared scaling and color conversion. For a 1080p output, use the corresponding 1080p reference. This measures the additional processing and encoding error at each output resolution, it does not measure the detail lost when reducing the source to D1.
To assess that end-to-end resolution tradeoff, also view both outputs at a common presentation size and examine the details the user needs. Do not rank different resolutions solely by their raw PSNR values.
A higher output bitrate cannot reconstruct detail already lost in a compressed input. Record source bitrate and output bitrate separately. Video bitrate also excludes MPEG-TS headers and metadata, so total network bandwidth is higher.
Reading the historical D1 example
These values illustrate the meaning of the scores discussed during the 7 October 2026 qualification. They are single-channel observations, using a moving 720×576 H.264 source at 25 fps and 2 Mbps, with 2 Mbps Flywheel output. The earlier GPU observation used a short picture sample, the later CUDA and CPU observations used capture interiors. The differing paths and checked intervals should remain visible when interpreting the comparison.
| Processing path and observation | Minimum matched RGB PSNR | Interpretation |
|---|---|---|
| Earlier installed NVIDIA EGL/GL path | Approximately 24.15 dB | Below the test's 28 dB picture-fidelity criterion despite near-25-fps output. |
| Replacement image, CUDA path | Approximately 34.32–34.48 dB | Above the criterion in the checked single-channel UDP and SRT capture interiors. |
| CPU reference on the replacement image | Approximately 33.92–34.16 dB | Above the criterion under the same D1 output settings. |
The roughly 10 dB difference corresponds to about ten times less squared pixel error. It is not a tenfold perceptual improvement, and the overlapping CUDA/CPU values do not establish a meaningful human preference between encoders.
The example checker requires at least 50 checked pictures, minimum matched RGB PSNR of 28 dB, worst regional RMSE no greater than 25, valid matching markers, no backward IDs, and no checked decoder errors. Its moving-source freshness gate permits at most 5% repeated IDs. These are qualification criteria for the declared fixture and method, not universal visual-quality grades, a user-configurable Flywheel quality setting, or a supported-channel guarantee.
Qualify concurrent channels on a shared GPU
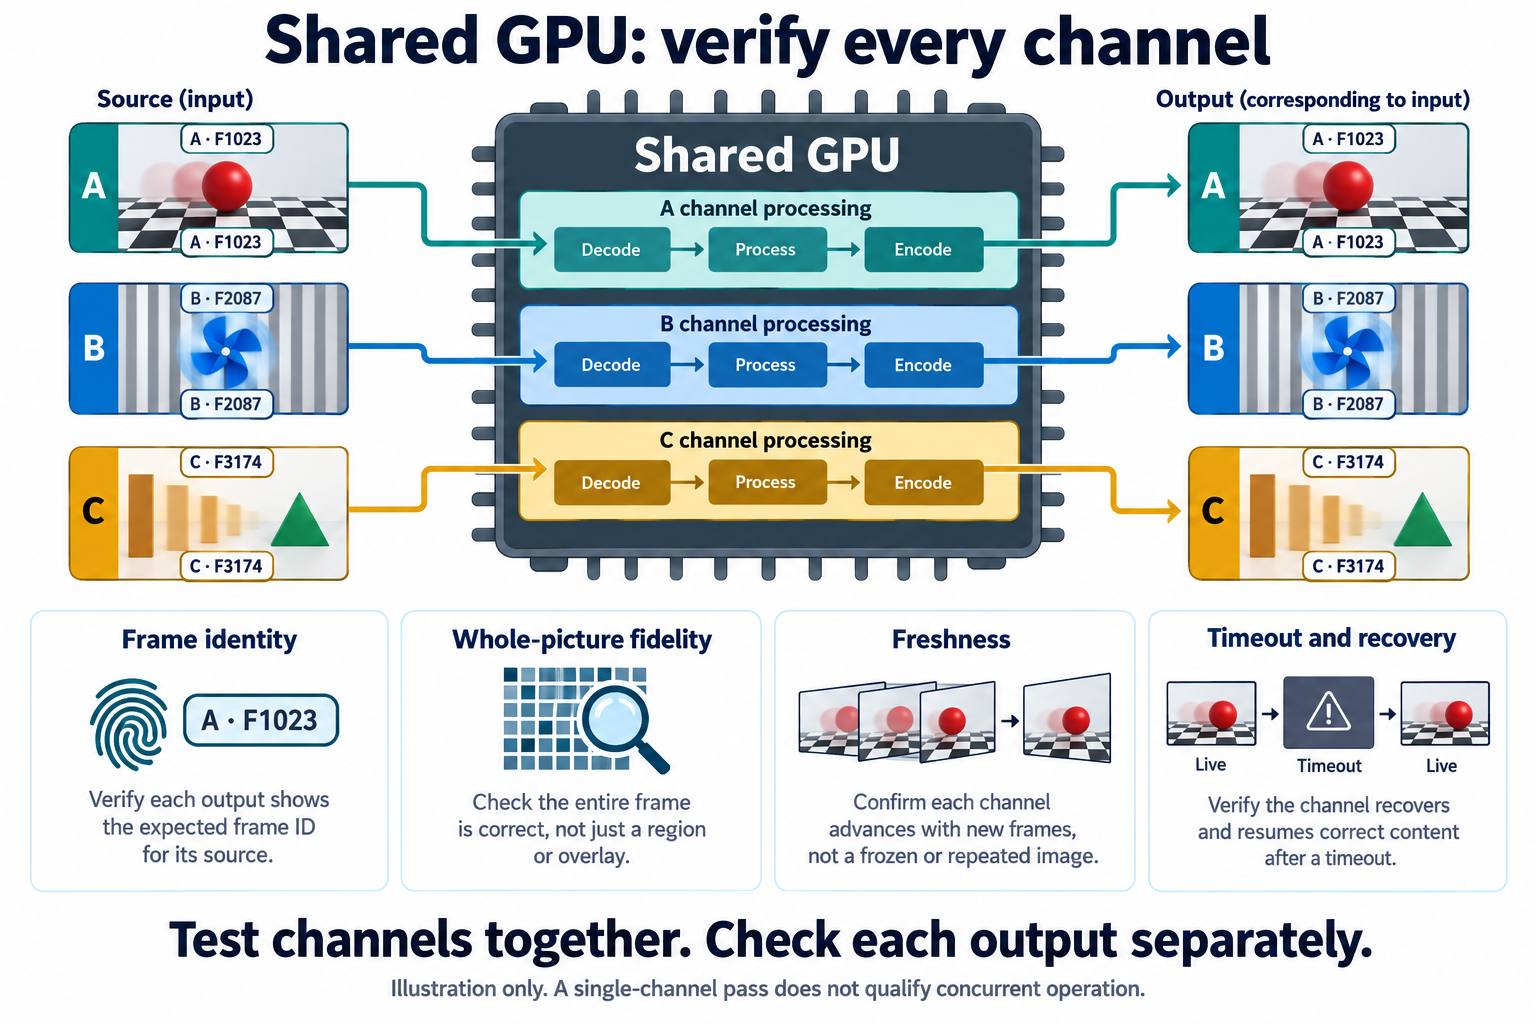
Start with one channel to establish a baseline, then test at least two simultaneous channels before increasing load. Check every channel during the same steady interval. Separate sequential one-channel runs do not exercise concurrent GPU ownership or resource contention.
- Give each source distinguishable moving content and a channel identity, as well as advancing frame IDs. Broadcasting the same synchronized fixture to every channel can hide a complete cross-channel swap.
- Capture each Flywheel output independently. Match each capture only to its own source reference and verify top/bottom marker agreement, orientation, whole-picture fidelity, regional damage, and frame progression.
- Measure arrival cadence and timestamps alongside picture checks. A stream can keep emitting 25 fps while repeating old content.
- Interrupt one source while the others continue. Verify its expected timeout visual and recovery, and confirm that the other channels retain their correct pictures. Assess intentional timeout graphics and fades separately from live-source PSNR.
- Repeat at each proposed channel count, resolution, bitrate, and transport, with both actual GPU processing and an explicit CPU reference. Record CPU/GPU load, available GPU memory, background workloads, and the decoder/compositor/encoder actually selected.
A GPU probe or listed encoder proves availability, not concurrent picture integrity. Accept a channel count only when all channels pass the picture, identity, freshness, cadence, and lifecycle checks. Keep captures and per-channel results: a combined average can hide the one output that failed.
What to record in a quality report
| Report item | Why it matters |
|---|---|
| Image digest, build commit, GPU/vGPU model, driver, and selected processing path | The same release version can identify rebuilt images with different runtime dependencies. |
| Source identity/hash, resolution, bitrate, frame rate, and color handling | Establishes the reference and makes comparisons reproducible. |
| Output codec, resolution, bitrate, GOP, preset, and intentional overlays | Defines the processing contract being evaluated. |
| Simultaneous channel count, transport, and background load | Describes the shared resources and actual test conditions. |
| Capture duration, checked interval, analysis resolution, and sample/whole mode | Shows how much video the measurement covers. |
| Per-channel minimum PSNR, regional error, marker failures, repeats, gaps, and decoder errors | Separates visual fidelity from continuity and identity failures. |
| Timeout/recovery observations and retained evidence | Shows whether correct content returns after a source interruption. |