📈 System Monitor
The System Monitor page has two views:
- Server dashboard – A live operations snapshot focused on streams, SkyView resource usage, and output health (WebRTC and recast targets).
- System dashboard – Host-level telemetry and historical charts for CPU, load, memory, and network traffic.
The System Monitor is available from the main menu and can be toggled on or off in server configuration.
📑 Server dashboard
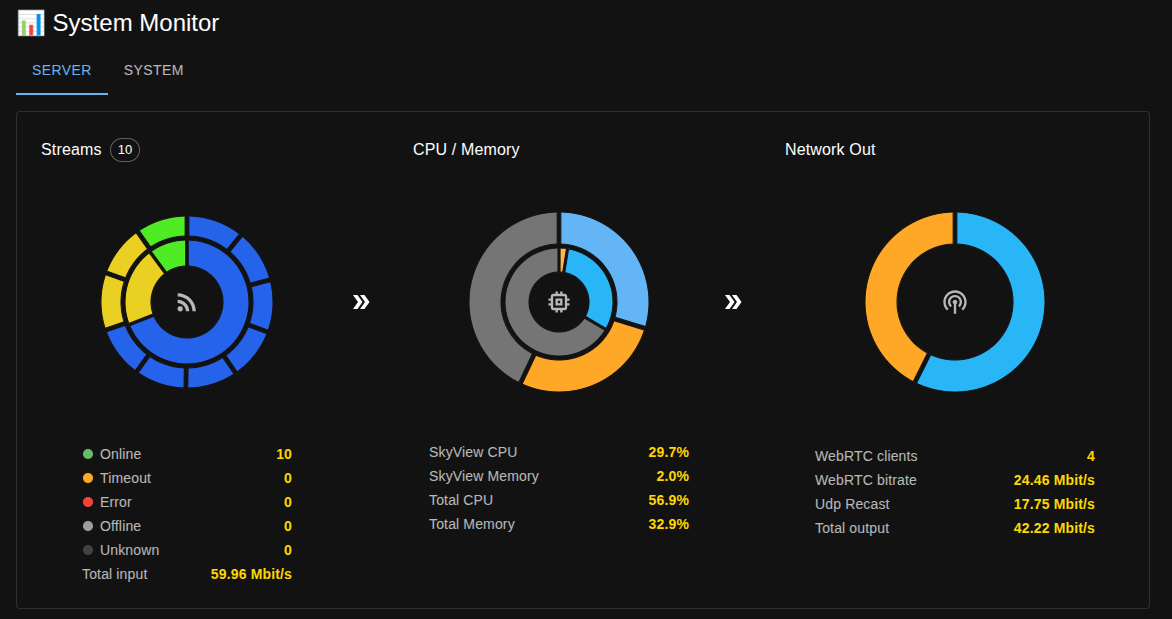
The Server dashboard summarizes live stream activity and SkyView output health.
- Streams – Two-ring donut view of input bitrate. The inner ring groups bitrate by platform, and the outer ring breaks it down by stream. The totals panel shows stream state counts (online/timeout/error/offline/unknown) plus total input bitrate.
- CPU / Memory – Dual donut chart that separates SkyView usage from other processes and idle headroom for both CPU and memory. The summary lists SkyView CPU, SkyView memory, total CPU, and total memory.
- Network Out – Output bitrate by target type (WebRTC vs UDP recast). The summary shows WebRTC client count, WebRTC bitrate, UDP recast bitrate, and total output bitrate.
You can view additional details by hovering over the chart:
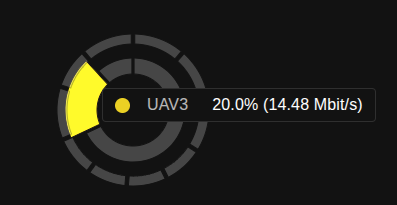
The Server dashboard updates continuously (roughly every second) and reflects live stream/output status, including recast targets when the license enables Recast mode.
🖥 System dashboard
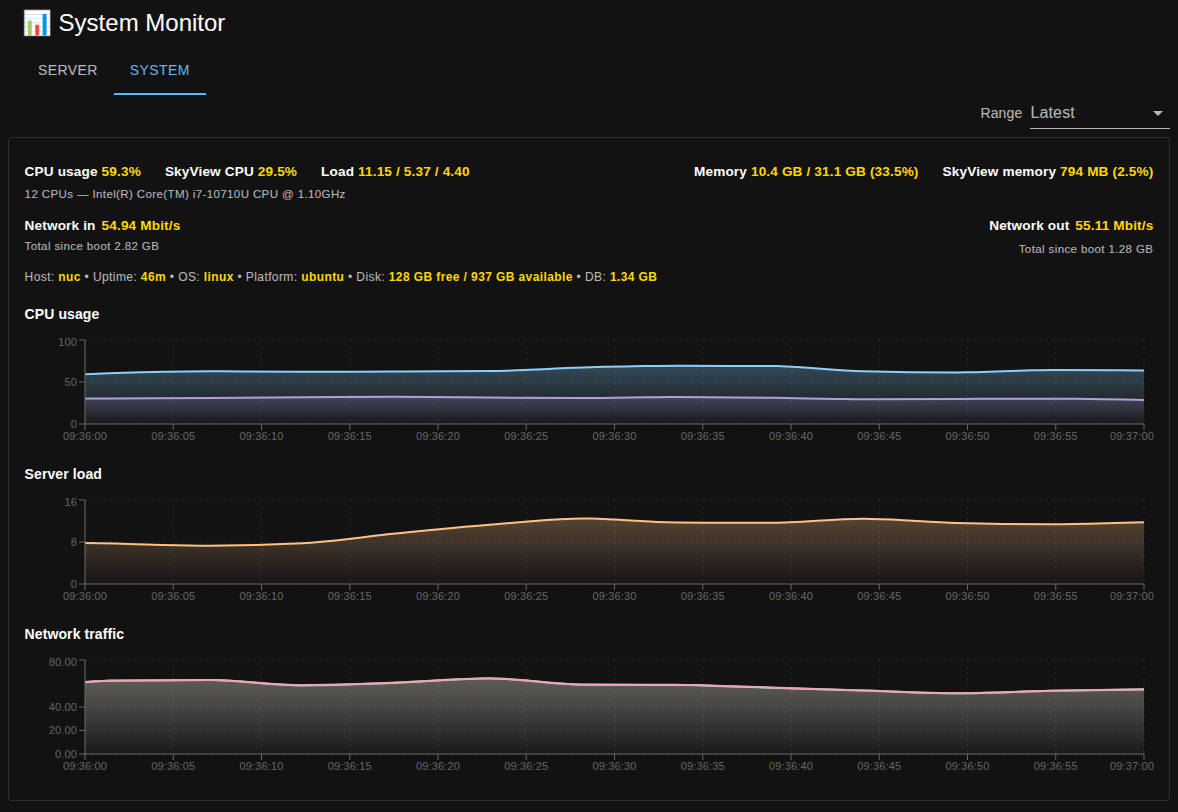
- CPU usage – Instantaneous CPU utilization across all cores.
- SkyView CPU – CPU utilization attributed to the SkyView process.
- Server load (1 / 5 / 15) – Standard Unix load averages, useful for spotting sustained CPU pressure.
- Memory usage – Used vs total memory with percentage, helpful for identifying pressure or leaks.
- SkyView memory – Memory usage attributed to the SkyView process.
- Network in/out – Current throughput (Mbit/s) plus cumulative bytes since boot.
- Host summary – Hostname, uptime, OS/platform, disk free/total, and analytics DB size (when available).
Each metric also appears as a short, textual summary above the charts for quick at-a-glance checks.
Live vs historical ranges
- Latest (live) – Shows recent in-memory samples (a few minutes) with 5-second refresh. This works even when Analytics is disabled.
- Historical ranges (5m, 15m, 1h, 3h, 6h, 12h, 24h, All) – Available when the Analytics option is enabled. System monitor samples are written to TimescaleDB; the backend returns raw data for short windows and aggregated buckets for longer windows. The charts display the full selected window, filling missing buckets with zeros so gaps or downtime remain visible.
Aggregation details (Analytics enabled)
- Up to 30 minutes: raw samples.
- 30 minutes to 6 hours: 5-second buckets.
- Beyond 6 hours: 1-minute buckets.
Tips
- Use Server load alongside CPU usage to tell transient spikes from sustained pressure.
- Network in/out quickly reveals throttling or unexpected spikes in bandwidth.
- If you select a long range shortly after enabling Analytics, early windows may be sparse until more samples accumulate. Zeros will appear where no data was recorded, keeping the timeline aligned with your selected range.