WebRTC debug console
The WebRTC debug console is an embedded HTML tool that ships with Sky View. Use it whenever you need to troubleshoot connectivity or playback quality for streams delivered through WHEP (WebRTC-HTTP Egress Protocol). You can open the console from Debug → WebRtc Debug in the application menu or launch the standalone HTML file directly.
Selecting a platform, sensor, and layer
The toolbar at the top of the console mirrors the structure of the Streams page:
- Platform – lists every platform that currently exposes at least one WebRTC sensor. Options are grouped by the platform identifier or name so you can switch sensors without losing track of which vehicle you are inspecting.
- Sensor – enumerates the sensors available under the selected platform.
Each entry combines the platform ID with the sensor ID so that the correct
PlatformandSensorheaders are sent when the debugger posts the WHEP offer. - Layer – shows the RID values published by the stream. When a source
exposes several simulcast encodings you can pick the RID (for example
hfor high resolution orlfor low) before connecting. Use the refresh button to re-query the available layers without reloading the whole page.
Whenever you change the platform or sensor, the console automatically refreshes its target WHEP session. Layer selection is locked while a call is active to ensure that the RID requested in the SDP offer matches the stream you are receiving.
Connection controls
Use Connect (WHEP) to start a session with the selected sensor. The console creates a receive-only peer connection, sets optional codec preferences, and applies low-latency playback hints as soon as the first video track arrives.
Three toggles alter the peer-connection behaviour:
- Low-latency (receiver hints) – requests a minimal playout delay and jitter-buffer target so that the decoder prioritises timeliness over jitter tolerance.
- Fast-drain on start – temporarily increases the HTML5 video element playback rate to 1.2× for the first 1.5 seconds to help the buffer catch up after the call is established.
- Try codec prefs (experimental) – sorts the browser codec capabilities and prefers VP8 or baseline H.264 profiles to help receivers that struggle with high-complexity encodings.
Disconnecting tears down the EventSource, closes all diagnostic data channels, and resets the UI back to its idle state.
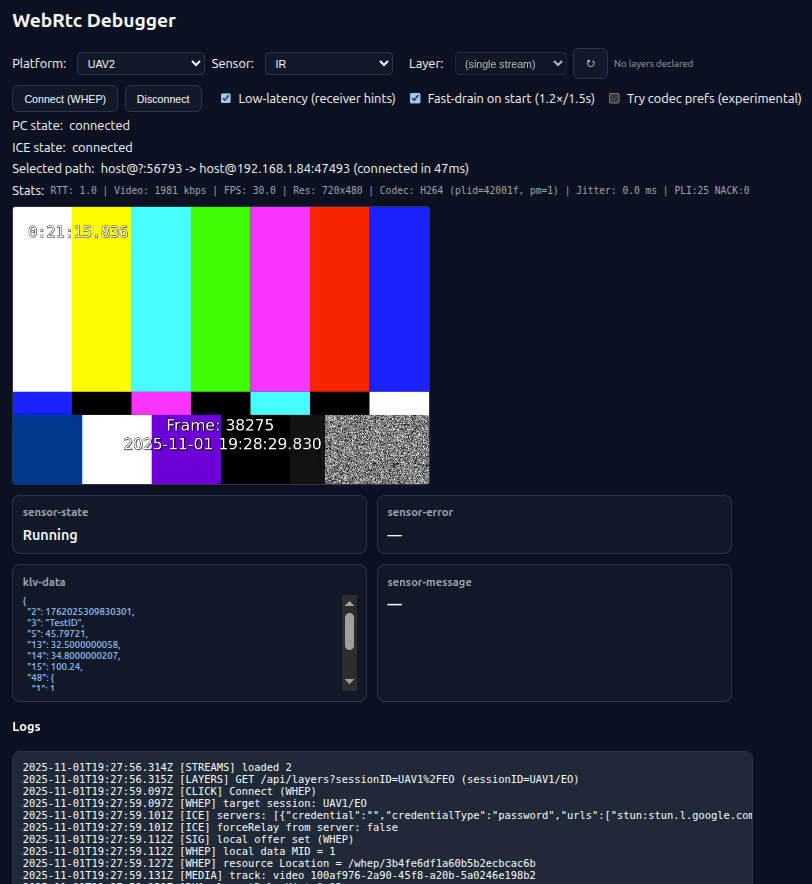
Understanding Selected path
The Selected path row shows the ICE candidate pair that the browser is
currently using. Every two seconds the debugger inspects the RTCRtpTransport
statistics, identifies the nominated candidate pair, and prints the local and
remote addresses plus their candidate types.
The format is:
<local-type>@<local-ip>:<local-port> -> <remote-type>@<remote-ip>:<remote-port> (connected in <ms>ms)
Typical candidate types are:
host– a direct LAN path using the sensor's private IP address.srflx– a server-reflexive address discovered through STUN, indicating that traffic is traversing NAT but still peer-to-peer.relay– media is flowing through a TURN relay because a direct path is not available or forced by policy.prflx– a peer-reflexive candidate, usually a one-off address derived during ICE nomination.
If the console cannot read the IP or port it replaces the value with ?. The
connection time appended to the message is either the instant the peer
connection reached the connected state or the elapsed time since the stats
polling started, which helps you correlate setup duration with network type.
Reading the Stats line
The Stats row aggregates frequently used inbound video metrics collected from
RTCRtpReceiver.getStats() every two seconds.
The fields appear in the following order:
- RTT – round-trip time in milliseconds computed from the selected ICE
candidate pair (
currentRoundTripTime). Values above ~150 ms can cause visible jitter on adaptive streams. - Video – estimated inbound bitrate. The debugger tracks the delta of
bytesReceivedacross polls and converts it to kbps. - FPS – the current decode rate. When the browser reports
framesPerSecondit is shown directly; otherwise the tool derives it fromframesDecodedover the polling interval. - Res – the last known video resolution using the HTML video element size or
inbound RTP stats (
frameWidth/frameHeight). - Codec – the MIME type plus notable
fmtpparameters (profile-level-id, packetization mode, scalability mode). The debugger reads the codec stats or falls back to parsing the SDP payload type. - Jitter – packet jitter measured in milliseconds (
inbound-rtp.jitter). - PLI / NACK – counts of Picture Loss Indication and Negative Acknowledgment RTCP feedback, useful for spotting packet loss or decoder resets.
A dash (—) means the value is not yet available. Stats automatically reset to
— when you disconnect from the session.
Live telemetry channels
Four unordered data channels expose extra telemetry from the platform while the
call is active: klv-data, sensor-state, sensor-error, and sensor-message.
The debugger logs every received message and shows the most recent payload in
its dedicated card. This lets you correlate playback issues with sensor status
changes in real time.
All console activity, including signalling events, ICE updates, and transport errors, is appended to the Logs pane with timestamps for later analysis.