📈 Stream bitrate
To monitor the stream’s bitrate in real time, press the Stream bitrate button:
This opens a dedicated bitrate panel just below the video player.

How the bitrate data is collected
The system measures the incoming stream’s bitrate once every second. Each measurement represents the actual data received during that one-second interval. This provides a precise, real-time picture of the stream’s behavior instead of averaged or smoothed values.
How the chart is displayed
The bitrate chart shows these per-second measurements across a fixed time window (for example, the last 1–5 minutes, depending on your configuration). As new data arrives, older points scroll out of view, giving you a continuous “live” trend line.
What the chart helps you identify
Because each point reflects one second of real traffic, the chart is extremely useful for spotting:
- Stream interruptions — sudden drops to zero or near-zero bitrate
- Network instability — frequent spikes, jittery patterns, or inconsistent throughput
- Encoder issues — abnormal drops in bitrate unrelated to network conditions
- Bandwidth limitations — when the stream repeatedly hits a ceiling or plateaus
- Short stalls or freezes — visible as sharp dips at specific timestamps
Hovering over any point reveals the exact bitrate and the timestamp, allowing you to correlate abnormalities with events on the video or logs.
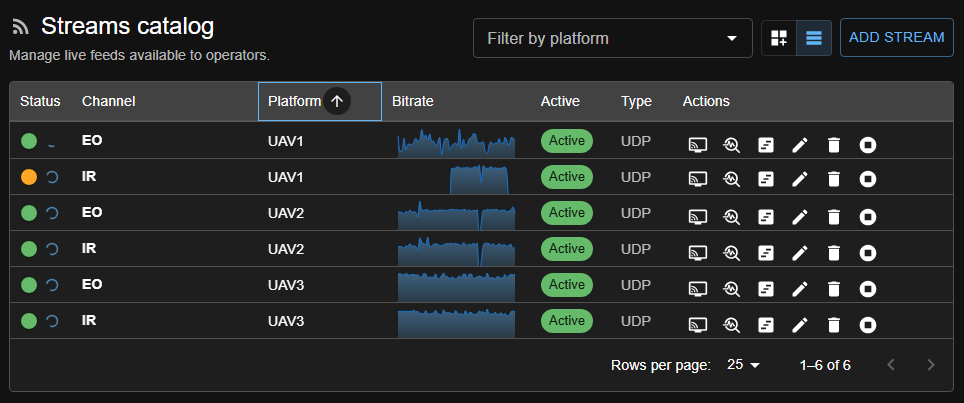
In addition to the detailed bitrate view inside the video player, minimalistic bitrate charts are also presented in the Streams Configuration page. These compact sparkline-style graphs provide a quick visual summary of each stream’s recent bitrate history. They update in real time and use the same per-second measurements, allowing operators to instantly spot interruptions, unstable streams, or abnormal fluctuations directly from the stream catalog, without opening the player. This overview makes it easy to monitor multiple video feeds at once and quickly identify which streams may require attention.
Historical data

When Analytics options is enabled, the player writes bitrate samples (in Mbit/s) into the database.
For longer time ranges, the backend serves aggregated data instead of raw 1-second points:
- Up to 30 minutes (5m, 15m): raw 1-second samples are returned.
- Up to 6 hours (1h, 3h): samples are grouped into 5-second buckets.
- Beyond 6 hours (12h, 24h, All): samples are grouped into 1-minute buckets.
Each bucket stores the average, minimum, and maximum bitrate along with the sample count. The chart renders the average as the main line/area, and the tooltip exposes the min/max and sample count for the hovered bucket. Missing buckets are filled with zeros so gaps in ingestion appear as flat drops, which makes interruptions easy to spot in the historical view (as shown above).
Why this is useful
A stable video stream should generally produce a smooth bitrate curve with minimal variation (for CBR streams). Any irregularities in the chart often correspond to real-world issues such as packet loss, congestion, misconfigured encoders, or intermittent reception. The bitrate view therefore becomes an essential diagnostic tool for operators and developers.