SRT Protocol Support

Overview
StanagProcessor is a versatile tool for processing and transmitting video streams with support for various network protocols, including the SRT (Secure Reliable Transport) protocol. The SRT protocol is ideal for low-latency streaming over unreliable networks and provides features such as encryption, packet loss recovery, and jitter correction.
StanagProcessor offers SRT input and SRT output capabilities, allowing it to both receive and contribute video streams securely and reliably.
SRT Input (Server Mode)
In SRT input mode, StanagProcessor acts as an SRT server, waiting for clients to connect and send data. This mode is useful when you want to receive streams from a remote SRT client and process them within the application.
Features:
- Server Mode: StanagProcessor waits for incoming connections from SRT clients.
- Low-Latency Streaming: It can receive real-time streams with a predefined latency over unreliable networks.
- Error Handling: SRT's built-in mechanisms, such as packet recovery and jitter buffering, ensure smooth transmission even in poor network conditions.
- Encryption Support: StanagProcessor supports encryption for secure transmission. You can enable AES encryption to protect the incoming stream from unauthorized access.
Configuration:
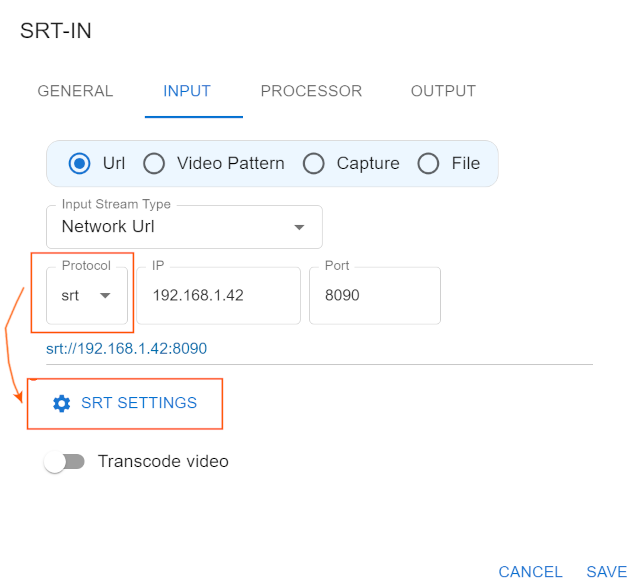
To configure StanagProcessor for SRT input, you will need to:
- Select srt protocol
- Scecify IP address and Port number
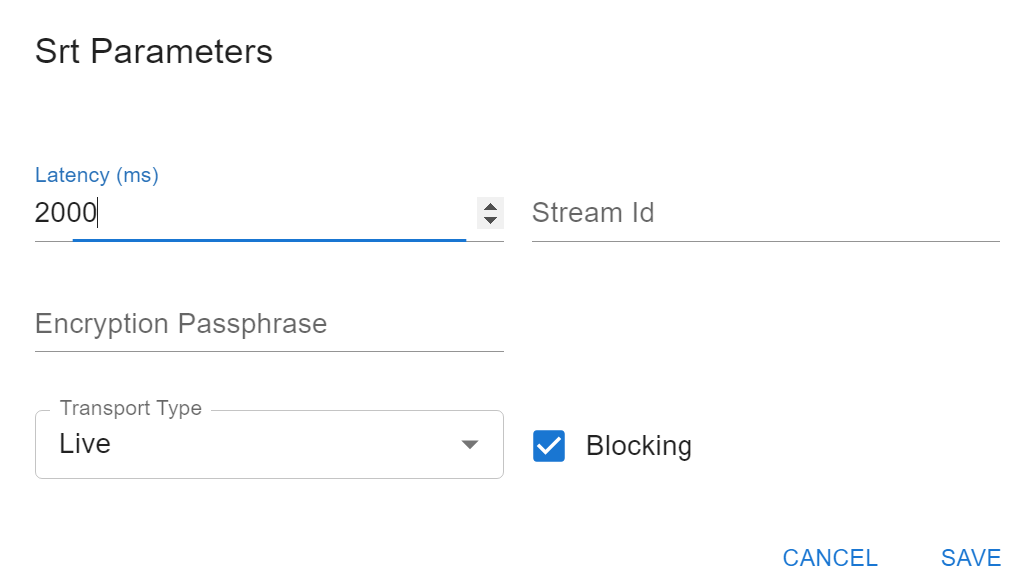
You can also set optional configuration parameters (in SRT Settings):
- Set required latency (in SRT Settings)
- Set optional Stream Id (sender only)
- Specify the encryption key and AES type (128-bit, 192-bit, or 256-bit) for secure communication
SRT Settings
SRT metrics
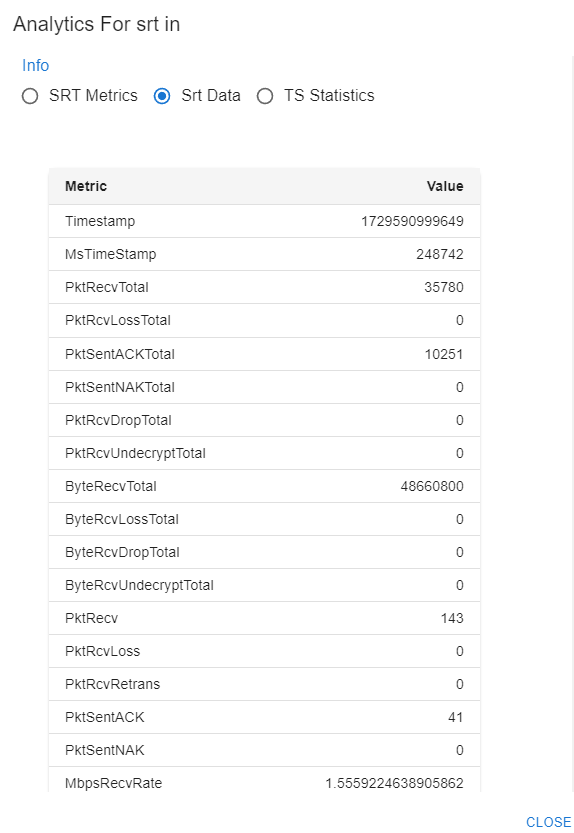
SRT provides a set of statistical data on a socket. This data can be used to keep an eye on a socket's health and track faulty behavior. Statistics are calculated independently on each side (receiver and sender) and are not exchanged between peers unless explicitly stated.
To ensure efficient and stable data transmission, it is crucial to monitor various metrics that provide insight into the connection’s health and performance. These metrics help identify potential issues such as packet loss, retransmissions, and bandwidth fluctuations, allowing for timely adjustments to optimize the streaming experience.
StanagProcessor allows monitoring of key parameters related to SRT connections, including packet-level statistics, bandwidth usage, loss rates, and delay measurements. By understanding and tracking these metrics, users can effectively diagnose network issues, fine-tune performance, and maintain a high-quality media streaming workflow over unreliable networks.
| Name | Description |
|---|---|
| MsTimeStamp | time since the UDT entity is started, in milliseconds |
| PktSentTotal | total number of sent data packets, including retransmissions |
| PktRecvTotal | total number of received packets |
| PktSndLossTotal | total number of lost packets (sender side) |
| PktRcvLossTotal | total number of lost packets (receiver side) |
| PktRetransTotal | total number of retransmitted packets |
| PktSentACKTotal | total number of sent ACK packets |
| PktRecvACKTotal | total number of received ACK packets |
| PktSentNAKTotal | total number of sent NAK packets |
| PktRecvNAKTotal | total number of received NAK packets |
| UsSndDurationTotal | total time duration when UDT is sending data (idle time exclusive) |
| PktSndDropTotal | number of too-late-to-send dropped packets |
| PktRcvDropTotal | number of too-late-to play missing packets |
| PktRcvUndecryptTotal | number of undecrypted packets |
| ByteSentTotal | total number of sent data bytes, including retransmissions |
| ByteRecvTotal | total number of received bytes |
| ByteRcvLossTotal | total number of lost bytes |
| ByteRetransTotal | total number of retransmitted bytes |
| ByteSndDropTotal | number of too-late-to-send dropped bytes |
| ByteRcvDropTotal | number of too-late-to play missing bytes (estimate based on average packet size) |
| ByteRcvUndecryptTotal | number of undecrypted bytes |
| PktSent | number of sent data packets, including retransmissions |
| PktRecv | number of received packets |
| PktSndLoss | number of lost packets (sender side) |
| PktRcvLoss | number of lost packets (receiver side) |
| PktRetrans | number of retransmitted packets |
| PktRcvRetrans | number of retransmitted packets received |
| PktSentACK | number of sent ACK packets |
| PktRecvACK | number of received ACK packets |
| PktSentNAK | number of sent NAK packets |
| PktRecvNAK | number of received NAK packets |
| MbpsSendRate | sending rate in Mb/s |
| MbpsRecvRate | receiving rate in Mb/s |
| UsSndDuration | busy sending time (i.e., idle time exclusive) |
| PktReorderDistance | size of order discrepancy in received sequences |
| PktRcvAvgBelatedTime | average time of packet delay for belated packets (packets with sequence past the ACK) |
| PktRcvBelated | number of received AND IGNORED packets due to having come too late |
| PktSndDrop | number of too-late-to-send dropped packets |
| PktRcvDrop | number of too-late-to play missing packets |
| PktRcvUndecrypt | number of undecrypted packets |
| ByteSent | number of sent data bytes, including retransmissions |
| ByteRecv | number of received bytes |
| ByteRcvLoss | number of retransmitted bytes |
| ByteRetrans | number of retransmitted bytes |
| ByteSndDrop | number of too-late-to-send dropped bytes |
| ByteRcvDrop | number of too-late-to play missing bytes (estimate based on average packet size) |
| ByteRcvUndecrypt | number of undecrypted bytes |
| UsPktSndPeriod | packet sending period, in microseconds |
| PktFlowWindow | flow window size, in number of packets |
| PktCongestionWindow | congestion window size, in number of packets |
| PktFlightSize | number of packets on flight |
| MsRTT | RTT, in milliseconds |
| MbpsBandwidth | estimated bandwidth, in Mb/s |
| ByteAvailSndBuf | available UDT sender buffer size |
| ByteAvailRcvBuf | available UDT receiver buffer size |
| MbpsMaxBW | Transmit Bandwidth ceiling (Mbps) |
| ByteMSS | MTU |
| PktSndBuf | UnACKed packets in UDT sender |
| ByteSndBuf | UnACKed bytes in UDT sender |
| MsSndBuf | UnACKed timespan (msec) of UDT sender |
| MsSndTsbPdDelay | Timestamp-based Packet Delivery Delay |
| PktRcvBuf | Undelivered packets in UDT receiver |
| ByteRcvBuf | Undelivered bytes of UDT receiver |
| MsRcvBuf | Undelivered timespan (msec) of UDT receiver |
| MsRcvTsbPdDelay | Timestamp-based Packet Delivery Delay |
| PktSndFilterExtraTotal | number of control packets supplied by packet filter |
| PktRcvFilterExtraTotal | number of control packets received and not supplied back |
| PktRcvFilterSupplyTotal | number of packets that the filter supplied extra (e.g. FEC rebuilt) |
| PktRcvFilterLossTotal | number of packet loss not coverable by filter |
| PktSndFilterExtra | number of control packets supplied by packet filter |
| PktRcvFilterExtra | number of control packets received and not supplied back |
| PktRcvFilterSupply | number of packets that the filter supplied extra (e.g. FEC rebuilt) |
| PktRcvFilterLoss | number of packet loss not coverable by filter |
| PktReorderTolerance | packet reorder tolerance value |
Analytics window
You can see the metrics in the Analytics window.
SRT charts
To effectively analyze network conditions and identify potential issues using the SRT statistics, user can combine different metrics into graphs. By visualizing these metrics together, you can gain valuable insights into network conditions, packet behavior, and the effectiveness of error recovery mechanisms
RTT, Latency, and Recommended Latency
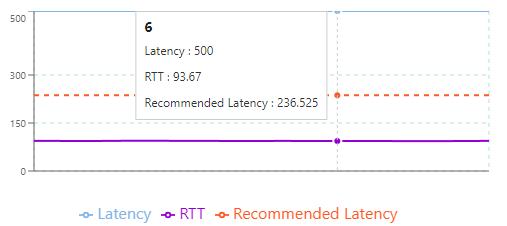
This graph illustrates the relationship between Round Trip Time (RTT), latency, and the recommended latency based on the maximum RTT.
- RTT (ms): The time it takes for a packet to travel from the sender to the receiver and back again. It's a critical measure of network performance.
- Latency (ms): The time delay in the transmission of data across the network. While lower latency is generally preferable for quick responses, a certain level of higher latency can improve streaming quality by allowing additional time for packet retrieval and retransmission. Finding the right balance is essential to ensure smooth communication and minimize interruptions during video playback.
Key Insights from the Graph:
-
Calculating Recommended Latency:
-
The recommended latency is calculated as Max RTT * 2.5.
-
This formula provides a safety margin to account for variations in network performance.
-
Packet Loss and Drop Analysis
Show Packet Loss and Drop Over Time. This graph helps in understanding how many packets are being lost or dropped due to network delays or errors, indicating possible congestion or reliability issues.
Metrics: PktRcvDrop (dropped packets) and PktRcvLoss (lost packets)
Retransmissions and Byte Loss Comparison
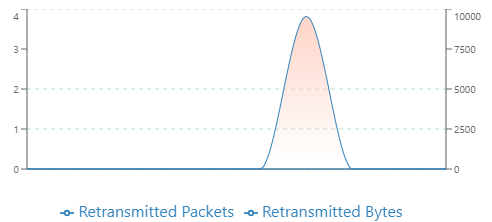
Correlating the number of retransmissions and byte loss over time can indicate if the retransmission mechanism is working effectively or if additional data is being lost.
Metrics: PktRcvRetrans (retransmitted packets), ByteRcvLoss (lost bytes), and ByteRetrans (retransmitted bytes)
Receiving Rate and Estimated Bandwidth
This graph shows the efficiency of the network. If the receiving rate approaches the bandwidth limit, it might indicate network saturation.
Metrics: MbpsRecvRate (receiving rate) and MbpsBandwidth (estimated bandwidth)
RTT and Packet Loss Correlation
Scatter plot can highlight if increasing RTT (network latency) results in a higher packet loss, which could indicate congestion.
Metrics: MsRTT (round-trip time) and PktRcvLoss (packet loss)
Retransmission Efficiency
This helps visualize how many bytes were retransmitted per packet, offering insights into packet sizes or retransmission efficiency.
Metrics: PktRcvRetrans (retransmitted packets) and ByteRetrans (retransmitted bytes)
Mbps Bandwidth and Mbps Send Rate
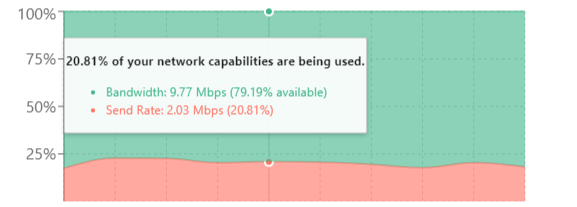
This graph provides a visual representation of how efficiently you are using the available network bandwidth in relation to your data send rate. This is crucial for optimizing performance, avoiding network congestion, and ensuring smooth streaming.
- Bandwidth (Mbps) is the total capacity of the network - essentially, how much data the network can handle at any given time.
- Send Rate (Mbps) is the actual rate at which data is being transmitted.
Key Insights from the Graph:
-
Percentage Utilization:
By comparing Bandwidth and Send Rate - you can easily see what percentage of your available bandwidth is being used.
A good rule of thumb is to avoid consistently reaching or exceeding 100%, as this can lead to buffering, frame drops, or poor video quality.
-
Identifying Bottlenecks:
If the Send Rate is consistently near or at the Bandwidth limit, this indicates that your network is being fully utilized.
Conversely, if the send rate is significantly lower than the available bandwidth, you’re not utilizing the full potential of the network.