📉 PCR-PTS Drift
Some encoders or remultiplexers let the PCR clock and the video timing timeline drift apart even when both values remain individually monotonic.
What this test checks
This rule measures true PCR-PTS drift against an interpolated PCR timeline.
For each sampled video frame:
- the validator selects the video timing timestamp, preferring
DTSwhen enough decode timestamps are present and otherwise falling back toPTS - finds the PCR sample before the frame byte offset
- finds the PCR sample after the frame byte offset
- interpolates PCR at that frame byte offset
- computes
PCR-PTS drift = video time - interpolated PCR time - subtracts a single per-stream baseline, using the median raw drift value, so the chart is centered for readability
This means the rule is checking rate mismatch, not harmless startup offset.
Why drift matters
Slow PCR-PTS drift usually points to an encoder or remultiplexer clock problem. Typical symptoms can include:
- gradual A/V timing instability
- decoder buffer stress
- video that appears to run slightly early or late relative to the transport clock
- streams that start cleanly but become less stable over longer durations
✅ Pass Criteria
The test passes when the absolute interpolated PCR-PTS drift never exceeds the configured threshold.
The default threshold is 100 ms.
Application result message:
No PCR-PTS drift above 100.000ms was detected.
❌ Fail Criteria
The test fails when the absolute interpolated PCR-PTS drift exceeds the configured threshold at any sampled video point.
In practical terms:
- positive drift means the video timeline is ahead of the interpolated PCR timeline
- negative drift means the video timeline is behind the interpolated PCR timeline
- the rule compares the absolute magnitude of that drift against the configured threshold
When drift exceeds the threshold, the validator raises ClockDriftDetected.
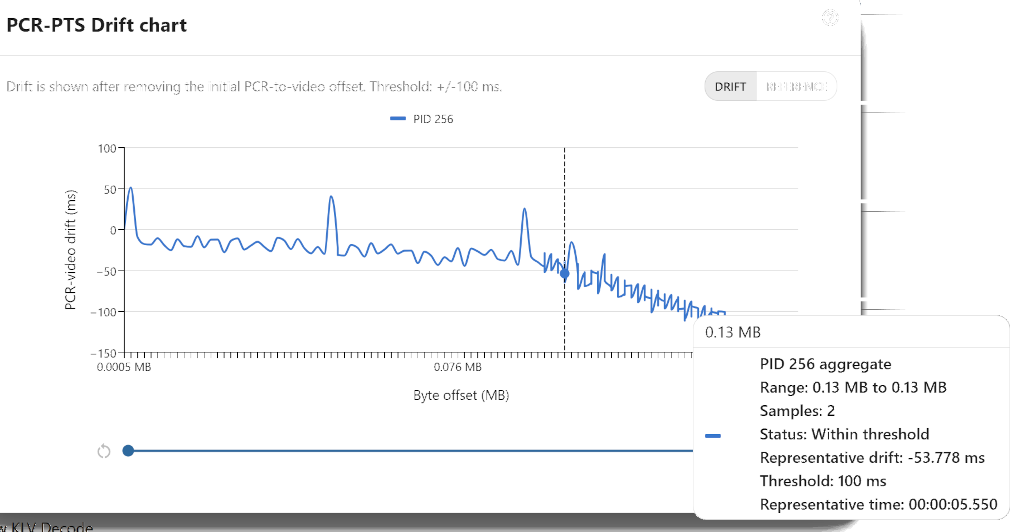
Chart Modes
The chart now exposes three modes.
Distance
Distance shows Frame-to-PCR distance.
This is the distance between each video frame PTS and the most recent PCR anchor. It is not the true PCR-PTS drift.
Use this mode when you want to inspect:
- PCR cadence
- spacing between PCR insertions
- missing or irregular PCR behavior
How to read it:
- a repeating sawtooth or spike pattern is expected
- spike height roughly follows the gap from the last PCR anchor
- this view is useful for transport timing structure, not for pass/fail drift interpretation
Tooltip fields:
Frame offsetVideo PTSLast PCRFrame-to-PCR distance
Drift
Drift shows the true PCR-PTS drift.
It uses byte-offset interpolation between the surrounding PCR samples and then subtracts the per-stream median raw drift baseline.
Use this mode when you want to answer:
- does the stream pass or fail the drift rule
- how large is the true drift in milliseconds
- where the drift crosses the configured threshold
How to read it:
- a line staying near
0 msmeans PCR and the video timeline remain rate-aligned - a steady upward or downward slope means the two clocks are drifting apart
- a clean stream should stay approximately flat around zero with only small jitter
Tooltip fields:
Frame offsetVideo PTSPrevious PCRNext PCRInterpolated PCRPCR-PTS drift
Reference
Reference keeps the same interpolated drift data but pins PCR at 0 ms so the video drift is easier to read visually.
Threshold guide lines remain at +/- threshold.
Use this mode when you want a more intuitive reference presentation of the same drift behavior.
Missing PCR anchors
The true drift metric is only computed when a frame has the required surrounding PCR information.
- if there is no previous PCR anchor, the point is omitted
- if there is no next PCR anchor, the point is omitted from the true drift series
- the validator does not fall back to last-PCR stepwise comparison for the real drift metric
The Distance mode can still show points that only have a previous PCR anchor.
Example
These charts show the same rule in its available presentations.
Passing sample result

In this passing example, the true PCR-PTS drift stays near 0 ms and remains inside the +/-100 ms threshold for the full visible range. Small movement around zero is expected after the per-stream baseline has been removed.
This is the expected shape for a clean stream in Drift mode: PCR and the video timing timeline remain rate-aligned, there is no sustained upward or downward slope, and no sampled frame crosses the configured drift threshold.
Chart mode examples
Distance should keep the familiar spike pattern because it follows the last PCR anchor.
Drift should be approximately flat around zero on a clean stream and show a long-term slope only when the PCR and video clocks are actually drifting apart.
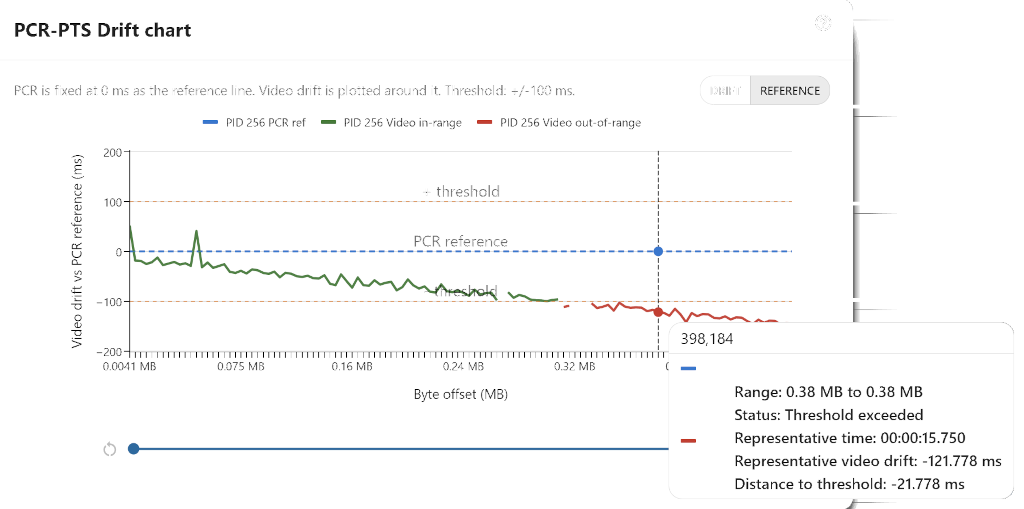
Reference uses the same real drift data as Drift, but keeps PCR fixed at 0 ms so it is easier to judge direction and threshold margin at a glance.
Test file
- mpegts-pcr-pts-drift.ts